DecaSIM Compete Beta

For the past month we have been revamping our Compete product. The aim of the product is to provide retailer category managers and CPG brand managers a view of the competitive landscape from the perspective of the shopper.
To achieve this goal we are adding over 30,000 grocery supermarket locations to a map and connecting them with publicly available price promotion data at a store level. Users will then be able to look at how their customers would respond to a full mix of promos that are live in any given week using our AI models.
We are using this data to write up our Who Won The Week blog posts Who Won The Week #2.
Basic Stats (As of 4/23)
- 7559 Zip Codes
- >60% US Population
- 50 States
- 24 Banners
- >12,000 Locations
For now the product just allows you to search for stores and then find local competitors. During the next phase we will add promotional data for each store, each week. This is when we will be able perform analysis of promotions each week. More on that in future posts.
Initial Insights
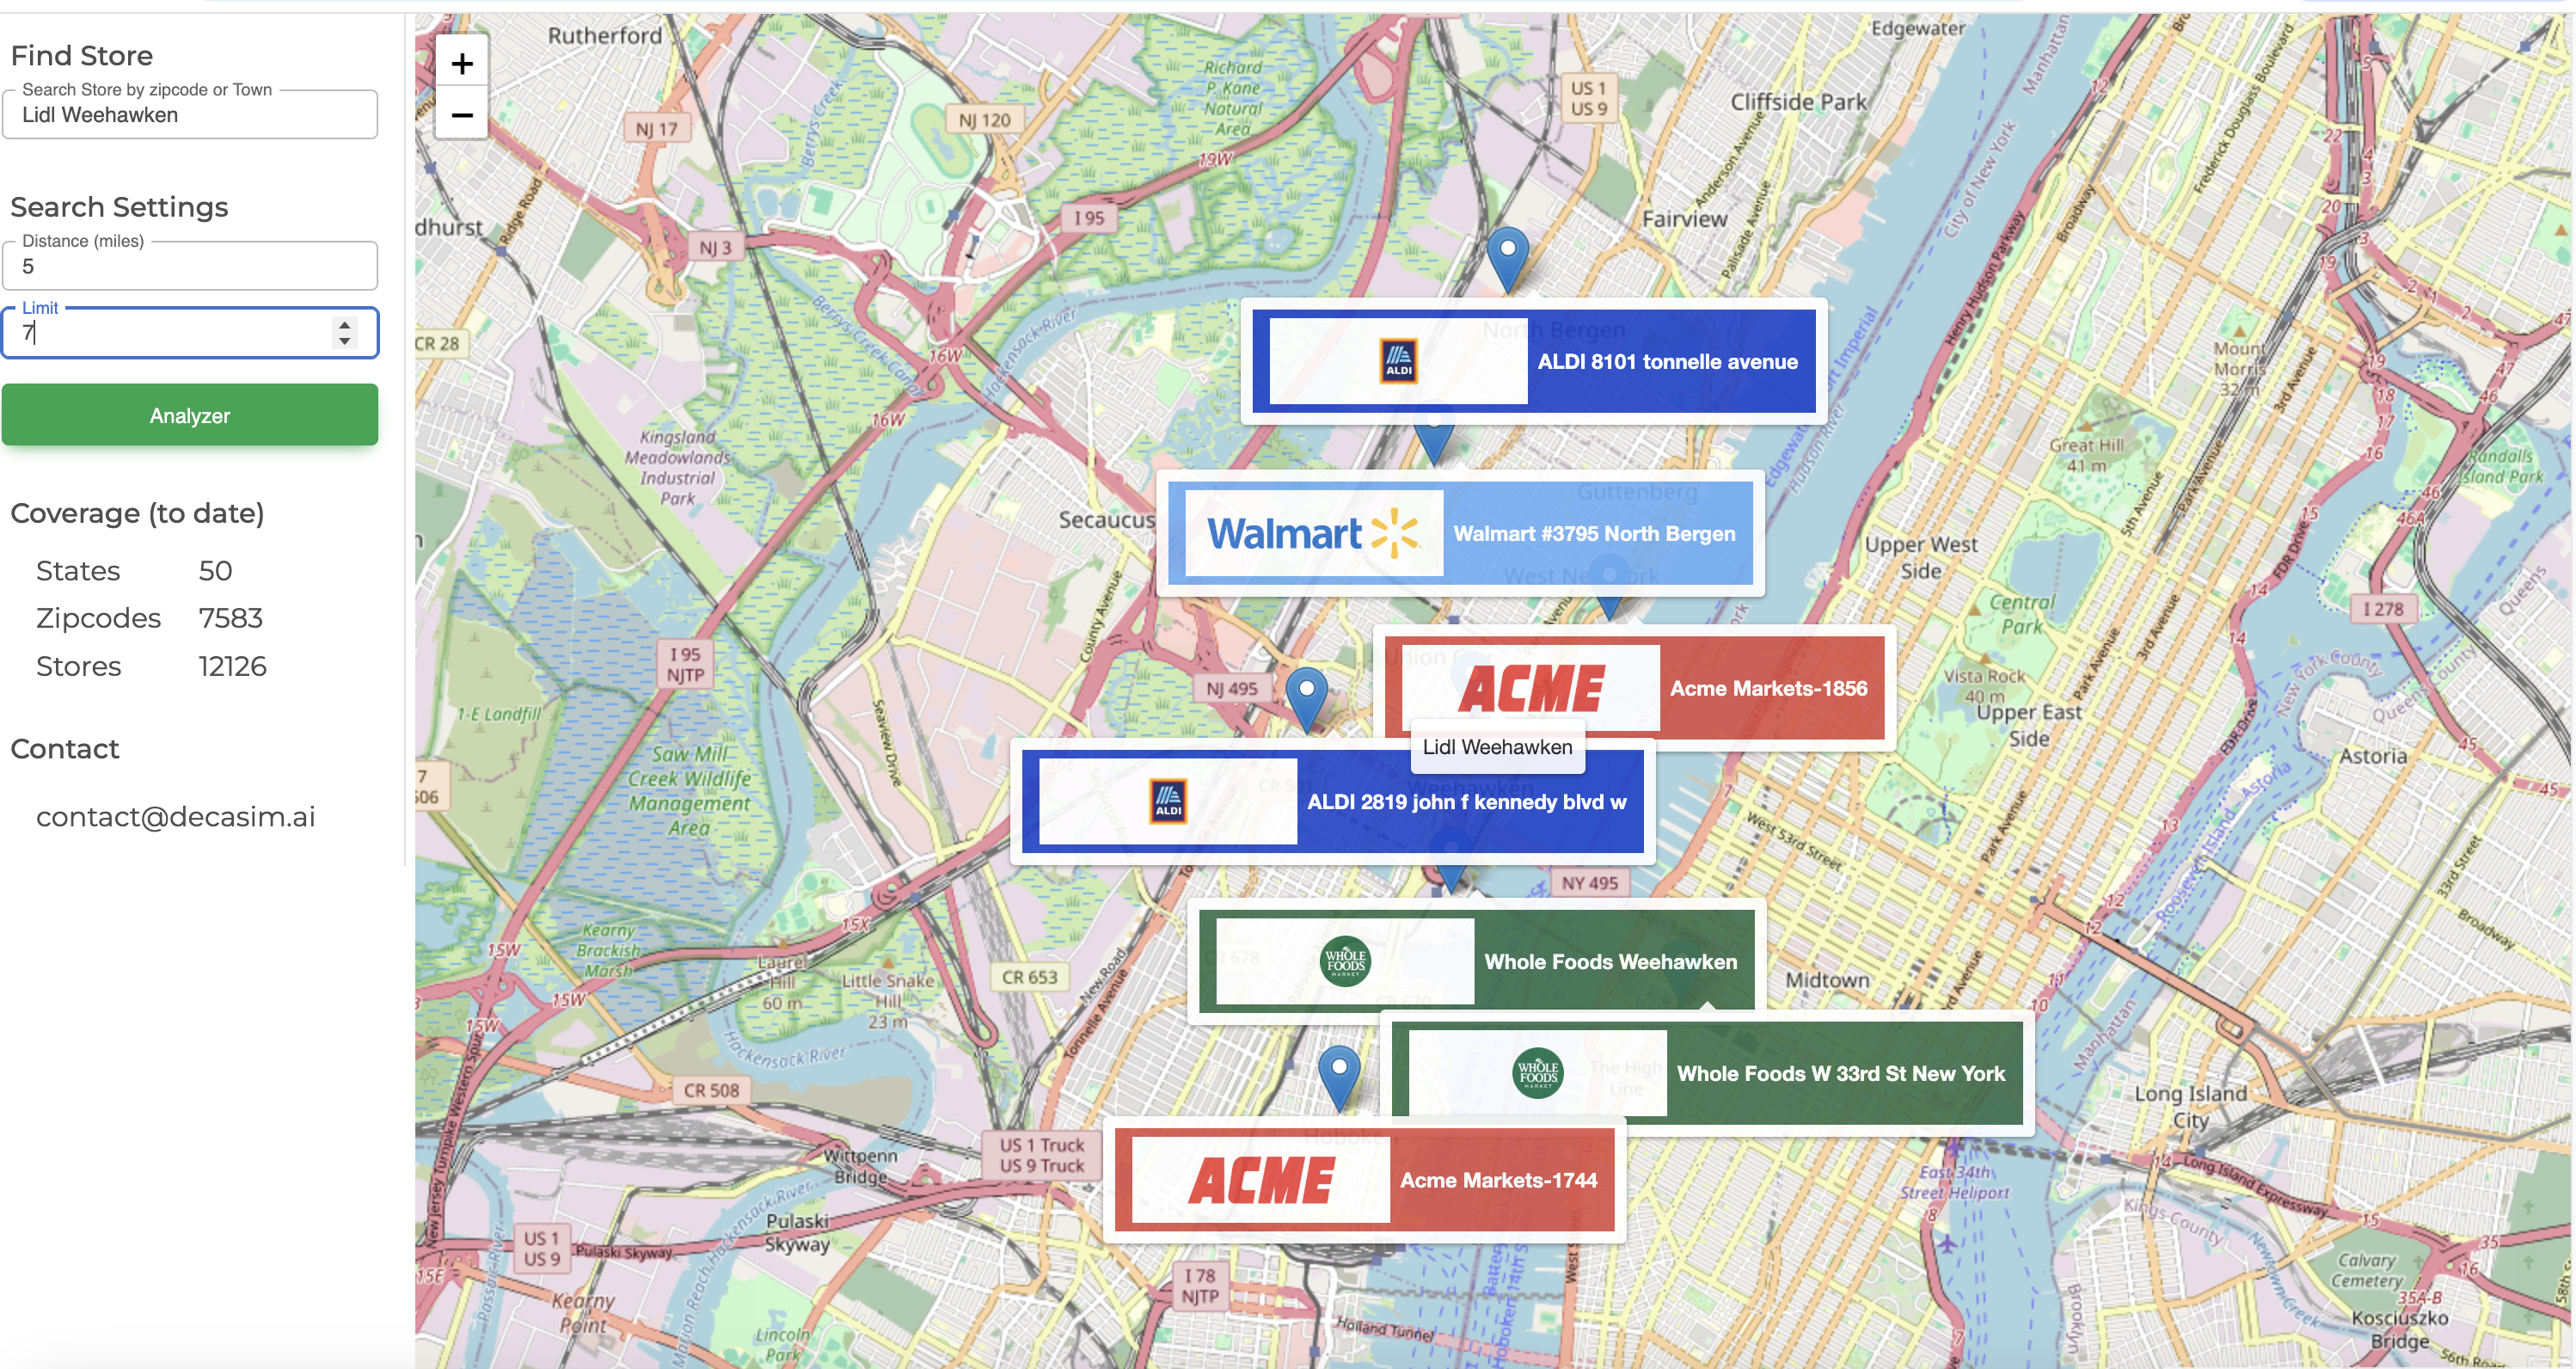
What this data allows right now is to identify the most and least competitive zip codes for retail according based # of competitors present.
For example these four zip codes contain 6 unique banners:
| Zipcode | Distinct Banners |
|---|---|
| 21236 | 6 |
| 21122 | 6 |
| 21401 | 6 |
| 21157 | 6 |
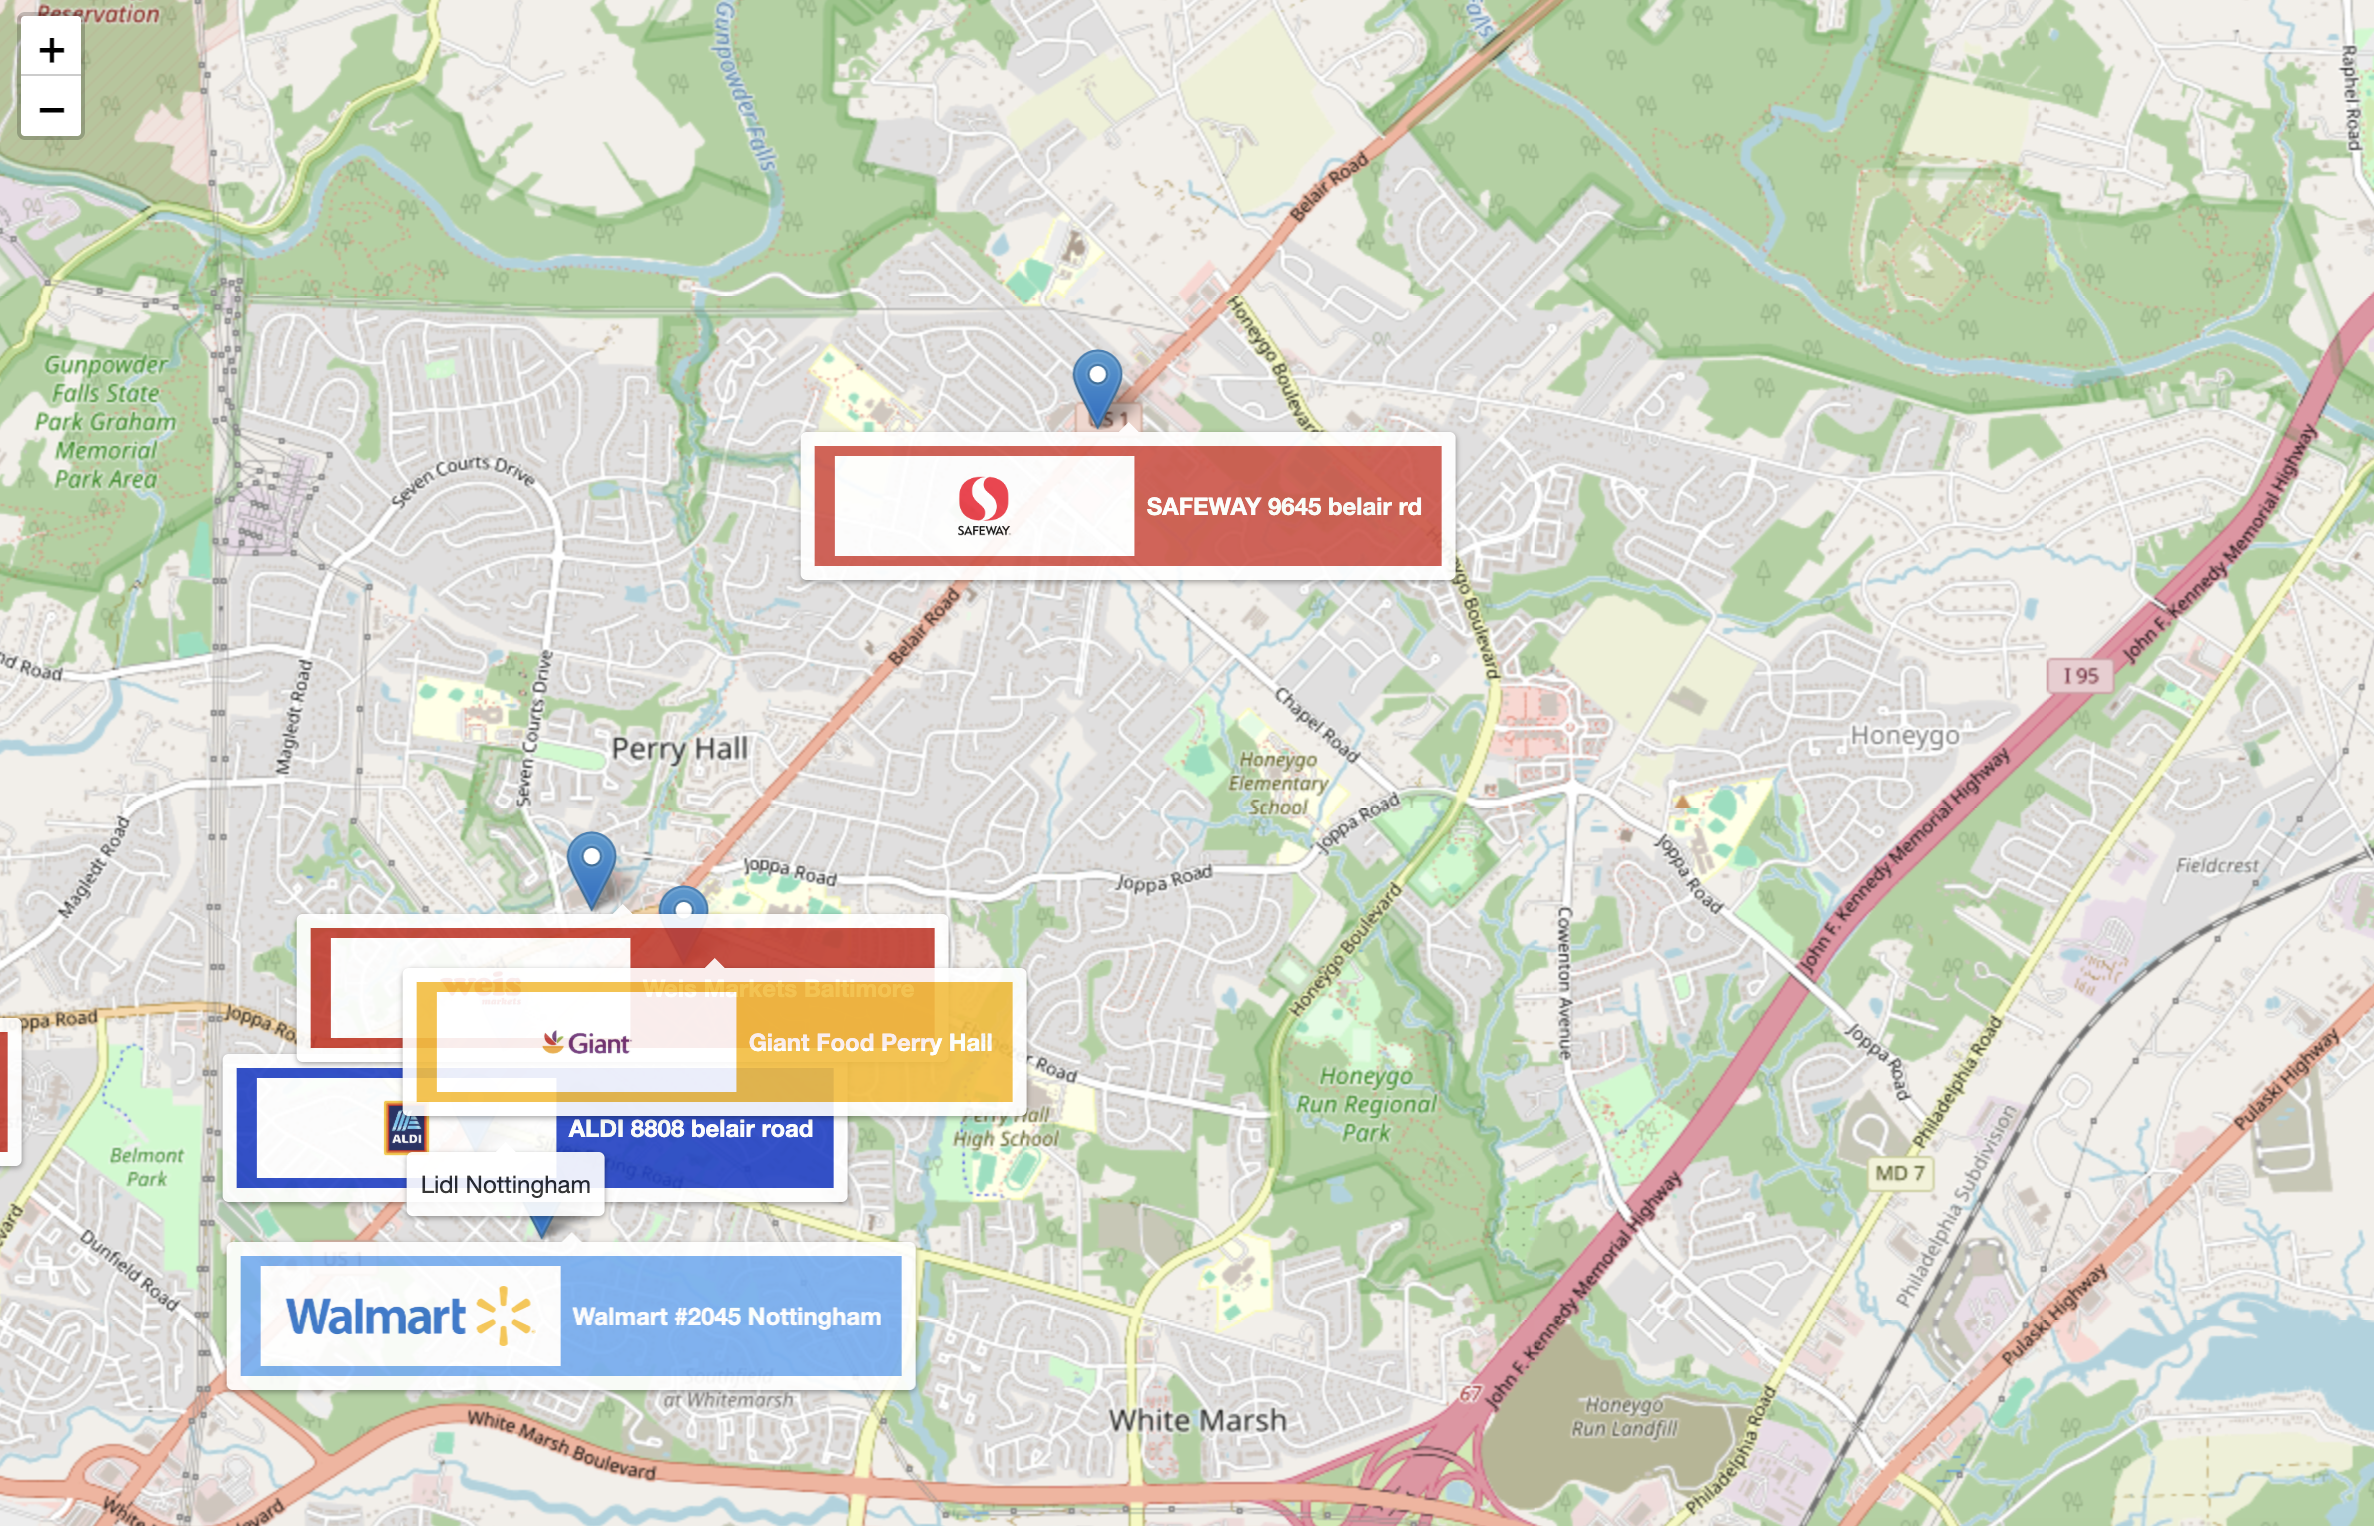
Zip code 21236 is for Nottingham, Maryland. As we have seen from our Who Won The Week posts, the Mid Atlantic region is one of the most competitive:
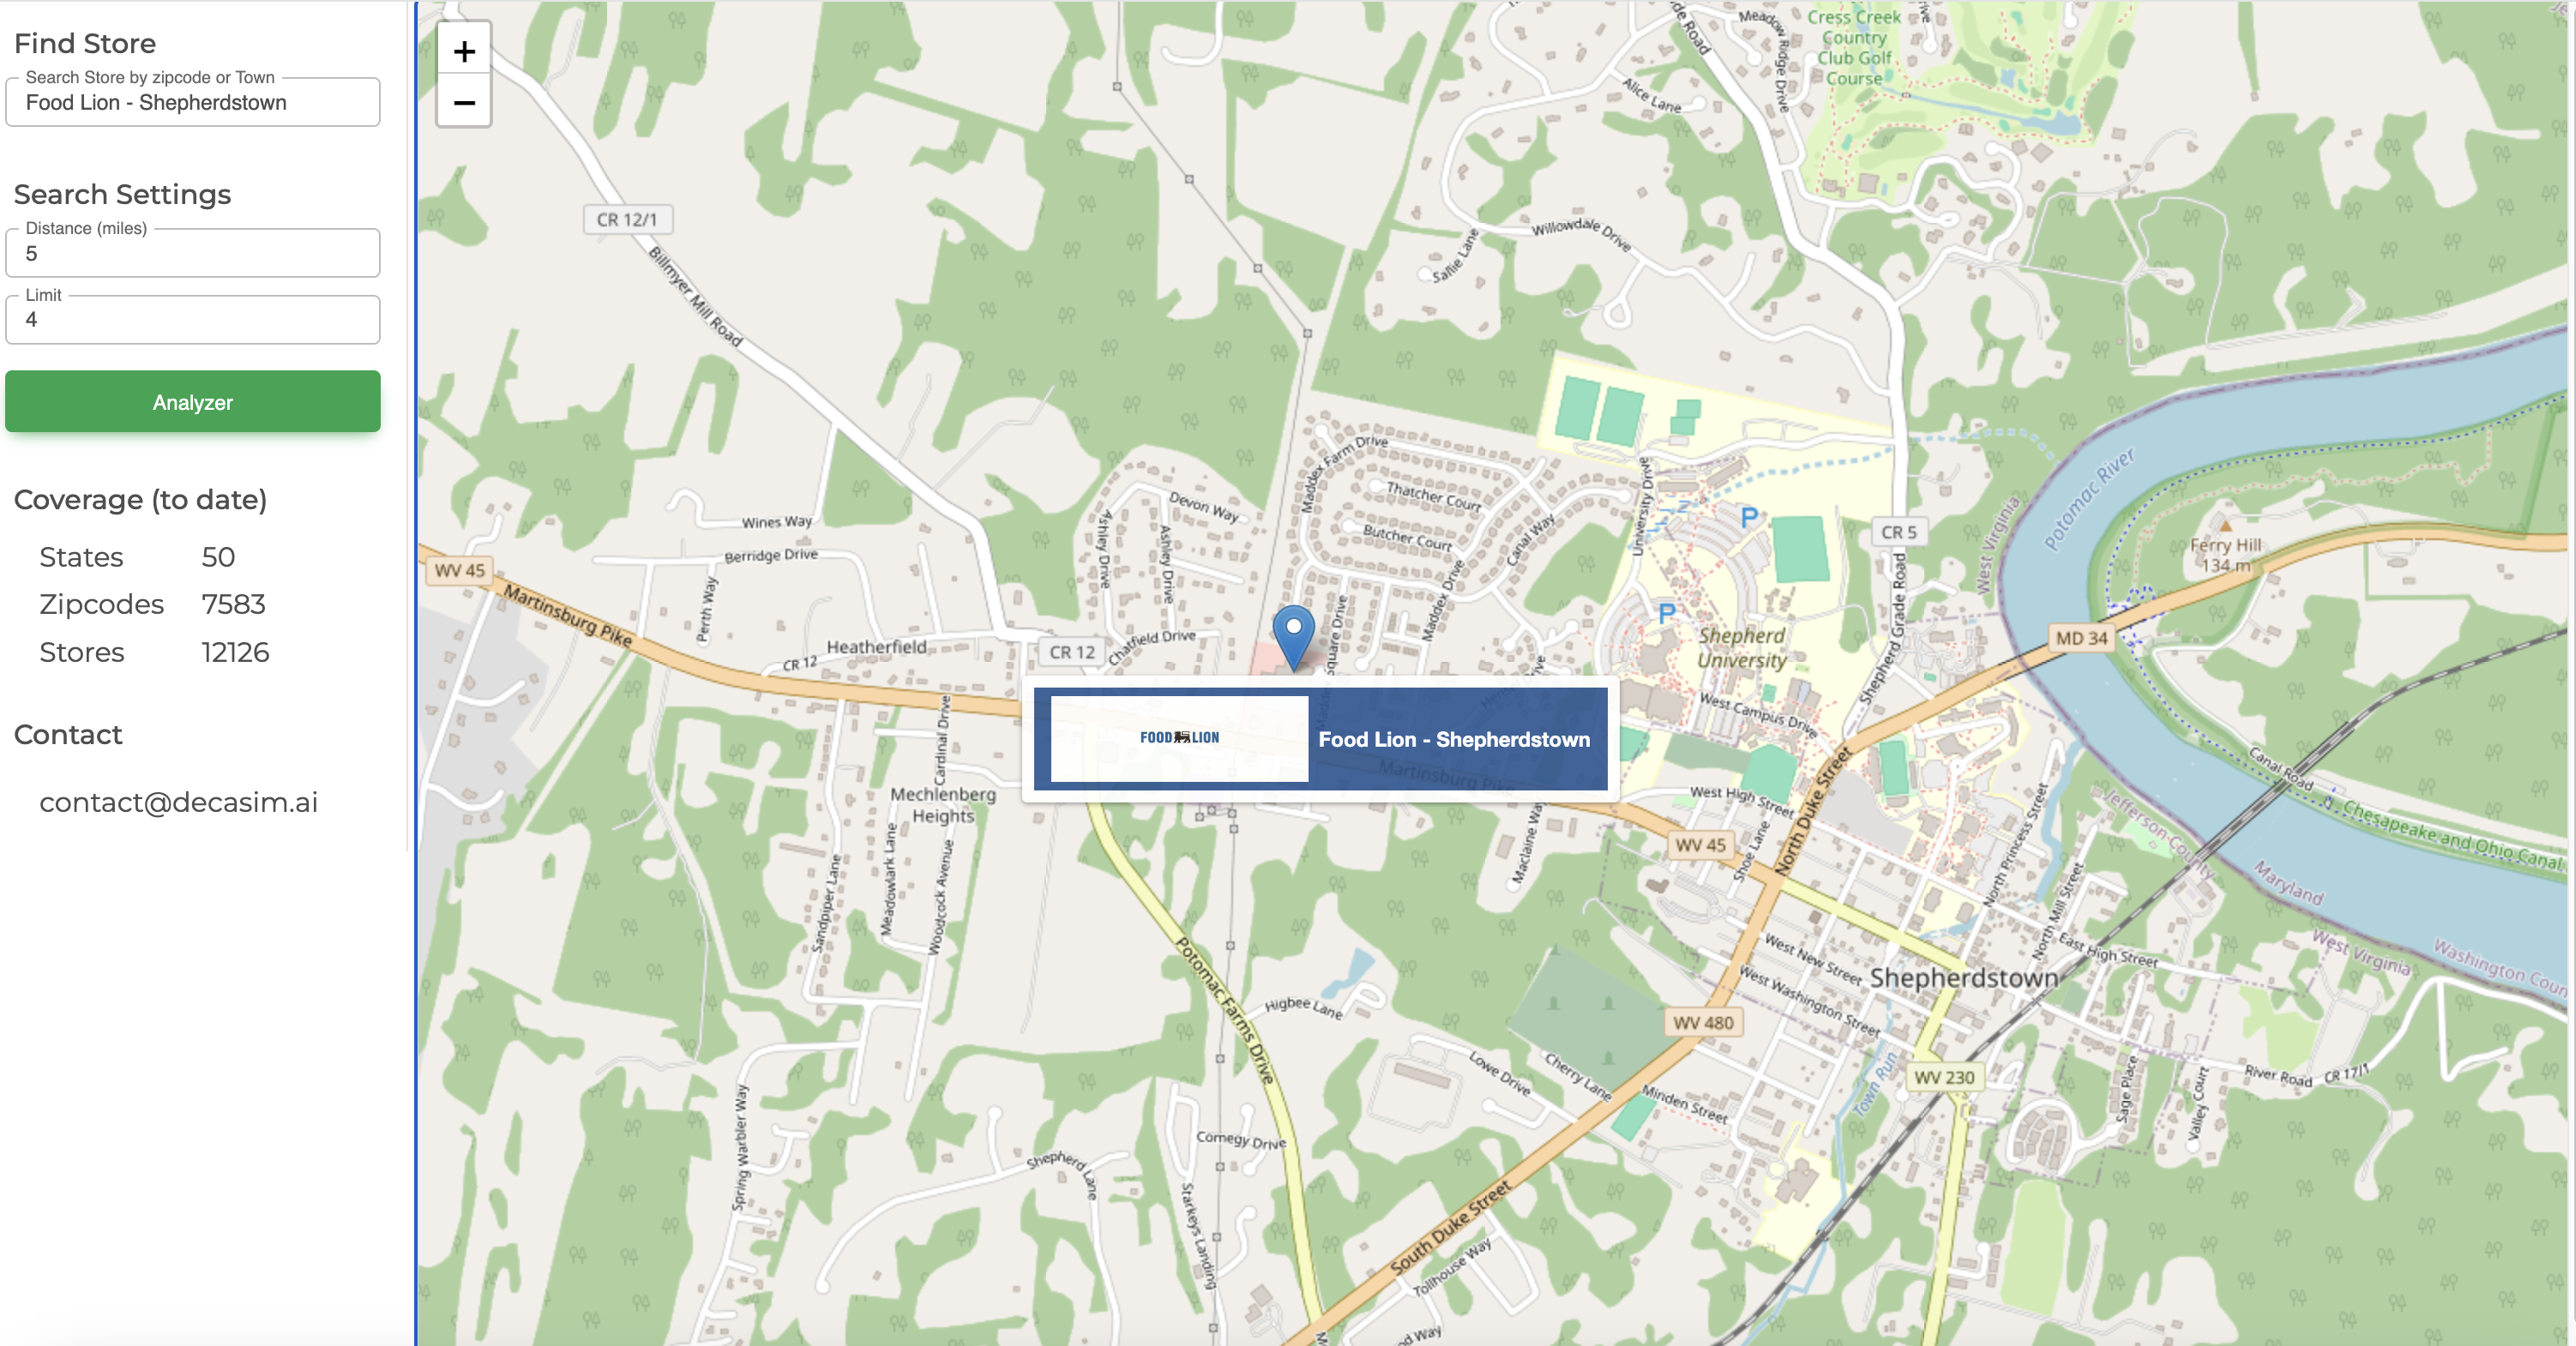
Whereas zip code 25443 is one of the least competitive zip codes, with only one distinct banner (Food Lion) in the town:
Further Analysis
With retail locations mapped, it becomes possible to identify which store in banner is most exposed to competitive activity. For example this could be the store, or cluster of stores, that are further away from the core distribution routes of the majority of banner locations. Or it could be the stores in a Hi-Lo banner that are closest to EDLP or Discounter banners. As we add more banners we will return to this topic.